Q: Why is land cover change significant?
A: Mapping change visualizes large-scale regional effects, either from policy and anthropogenic trends or natural environmental changes.
Mapping change is harder than it sounds. First, the products for both times must be mapped with the same framework and to the same standard. Second, we differentiate areas of change from areas without change. Only the change areas are mapped, based on spectral signatures and ancillary data, without the need to map the entire area wall-to-wall for each date (this decreases consistency and accuracy due to class and spectral confusion). With an addition of some fancy rule sets, the final component is a new classification of changed areas only which is then simply laid on top of the first date data; theoretically the updated map is an accurate representation of the second date data and that which was mapped is the change product.
NOAA’s Coastal Change Analysis Program (C-CAP) produces both land cover and land cover change products using 25 land cover classes. The change data are simply the difference between two land cover maps but with 25 available classes for each product. The matrix needs to be at least 625 classes to accommodate each distinct class-to-class change. Change can be in the form of development, such as greenspace at your local park converted to a large public restroom between 2006 and 2010. Change here is a class of 104 (2006 as “Development – Open Space, Class 5” to a 2010 class of “Developed – Low Intensity, Class 4”). The change matrix class designation formula is:
Total_Classes x (Date1_Class – 1) + Date2_class = Change Matrix Row Classification.
C-CAP also has an attribute table with the names of the classes involved and a bivariate field constructed as XXYY where XX is the Date1_class and YY is the Date2_class.
Storing 625 classes not only exceeds 50 shades of gray, it also exceeds the limit of 256 numbers available with eight bits, so we have to use 16-bit data types for our rasters. Many remote sensing and GIS-oriented software packages don’t have a problem with that, but your typical photo editing software might not like it at all. Even some leading GIS packages may not display the colormap correctly (a future GeoZone post).
The C-CAP landcover change matrix products are available for all the coastal regions of the U.S. The 30-meter resolution products span four five-year cycles for the contiguous coasts, and up to a 29-year time series for selected regions. There are also higher resolution (1 to 5 m) coverage for many of the territorial islands and regional management reserves. The Digital Coast Data Access Viewer (DAV) has provided 8-bit land cover outputs for quite some time but with changes in the system (see this GeoZone post). These 16-bit change products are also now available for custom areas downloads. This means many areas now have downloadable content for landcover, landcover change, imagery, and lidar too.
Below is an example of common 30 m change mapping artifacts captured in cyclic iteration using Landsat 7 satellite imagery. (Landsat scenes are available from USGS, imagery from Google Earth’s historical time series and the land cover data is from the C-CAP library).
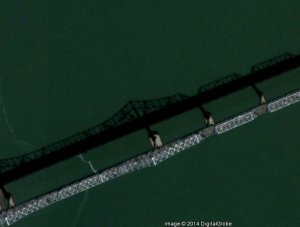
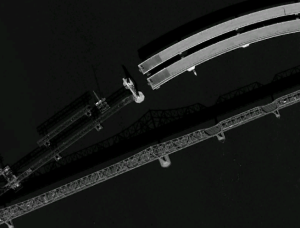
Images 1 and 2 Open water in 2005 (class 21) became the under construction San Francisco-Oakland Bay Bridge in 2010 (class 3); construction ended in 2013. The older bridge (south of the construction) dissemble began; an artifact land cover change mapping will undoubtedly find in the next iteration (development to open water).
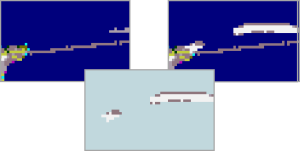
Image 3 (below) includes 2006 CCAP Land Cover (top-left), 2010 C-CAP Land Cover (top-right); 2006-2010 C-CAP Change Product (bottom-middle). The change product highlights only the modified areas, containing all the matrix of class-to-class possibilities.
The key to the change presentation is the colormap applied to those 625 values. Even though all the combinations of class change present are represented with individual values, all the combinations in which the class didn’t change are colored the same bluish-gray. That lets you focus on the change areas without muddying the landscape with areas which didn’t change.


Good topic Eric. Thanks for reminding me of those details that I should have remembered from my remote sensing classes. Looks like change detection is getting better, but even harder to do with the higher resolution imagery.
LikeLike