So you’re interested in how much wetland has been lost in your coastal area over the last 10 years. Or maybe you just want to know how much of your region is developed for a vulnerability assessment. So what do you do? Of course you start looking for the best high resolution land cover data you can find. But you notice something. You either need to pay for pre-existing high res data (if available) or you have to settle for data at a lower resolution. Or if you’re looking for data captured during very specific conditions, or times of the year when the free stuff is unavailable, you may have to acquire new imagery. Of course you need the very best, so you start calculating the cost for data in your area of interest. But what’s your question? What are you trying to figure out? Oftentimes, moderate resolution data is suitable depending on the issue. And depending on what you need, it may be freely available and readily downloadable in multiple formats.
C-CAP Land Cover Data As an Example…
Do you care how much wetland area has been lost in your county? Or are you interested in a specific type of wetland loss and whether it was permitted? Or do you need to be able to see the boundaries of specific wetland types?
Are you interested in the amount of forest lost or gained in your area, or do you want to know where each individual tree is?
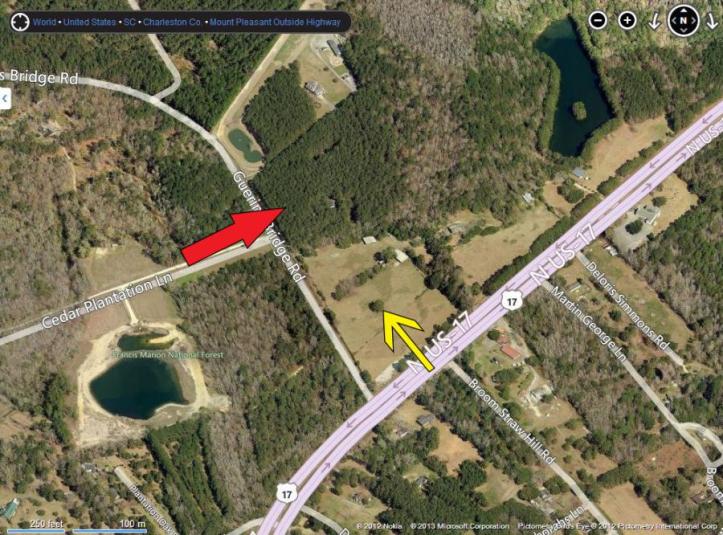
If you want to map the forest (red arrow), coarser spatial data may work. If you want to map the single tree (yellow arrow), then high res data are needed.
Think about the smallest thing you need to identify. If it’s an urban center or the amount of newly developed area, you might be good to go with the product on the left. The image on the right may be overkill…
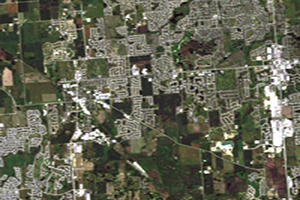
|
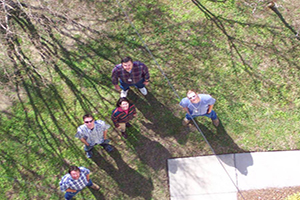
|
What’s It Worth to You?
If a high res data set is indeed what you want, maybe you could think about prioritizing where it’s needed. If you are looking to pay for a full high resolution update of C-CAP data and have some knowledge that nothing changed in 25% of the area, this would be a good time to pinpoint where moderate resolution vs high resolution is sufficient. For example, C-CAP moderate resolution data costs less than $2 per square mile, while the high resolution can cost as much as $250 per square mile (see previous blog Spatial Detail vs. Map Accuracy). Moderate resolution data may be used to initially identify potential areas of change, where you could then supplement with higher resolution data. The upfront cost of the moderate resolution data may be recouped by NOT having to map your full area at high-resolution. Note that even if the higher resolution imagery is free, it can be more time consuming and expensive to develop a map product from the more detailed imagery. The saying “you get what you pay for” goes both ways because you also pay for what you get. Another thing to consider is combining moderate resolution data with other data sets. Moderate resolution C-CAP data can be used with other data such as the National Wetlands Inventory or the National Agriculture Imagery Program to get the best of both worlds. Estimates of wetland loss derived from C-CAP data are often extremely close to those of more detailed studies; however, the spatial areas mapped as losses in C-CAP do not always match. Singly, C-CAP data are very useful as a screening tool to get an estimate of the total amount of wetland loss, but in combination with other data sets such as NWI, one can also identify where the changes are occurring.
When considering your spatial resolution requirements, think about the smallest objects that need to be identifiable. If the answer is still, “Yes, I really do need 1 to 4 meter resolution data,” check out the C-CAP high res data available through the Digital Coast or talk to us about acquiring new data.

[…] think of when they hear the term resolution, and this has been discussed in many past blogs (“How Low Can You Go?” “Lidar – Accuracy Versus Resolution,” “Spatial Detail vs. Map […]
LikeLike