
[Update: In November 2014, ASPRS published new guidance for accuracy classes that includes recommendations for pulse spacing in addition to vertical accuracy.]
Resolution != Accuracy
It seems like every day I hear a statement about high-resolution lidar that bugs the heck out of me. I even hear it from our staff at the Center. So, I thought I’d write a little entry about it and see if any of them pick up on it. So, what I hear is, “We need high resolution lidar for X, Y, and Z.” Sometimes it’s for estimating sea level change impacts, sometimes it’s for habitat modeling; could be for nearly anything. While I do often hear it for sea level change, my example is wetlands delineation in relatively flat areas like South Carolina or Florida. To quote one friend (we’ll call him Randy) interested in wetlands:
It appears that most of it will be point spacing of 1.4 meters which will only give me 2’ contours. This will not be that useful for me in the Lowcountry with difficult wetland issues. I need to be able to get to 6” contours or no more than 1’ contours. I wonder how much data there is out there with point spacing of 0.5-1.0 meter?
This sort of problem is not that uncommon, so let’s take a closer look at what Randy needs and what’s he’s asking for. Like many others, Randy is confusing accuracy with point spacing (aka resolution). Accuracy is a measure of how closely the measured values are believed to be to the true values. In the case of lidar points or a digital elevation model, it’s the accuracy of the elevation that we’re talking about. The point spacing generally refers to how far apart the measurements are. For a digital elevation model, this would be the grid spacing or resolution.
Contours – Do You Really Need Them?
So, how does the contour interval come into it? The contour interval allowed is not related directly to the point spacing. When the guidance for contour intervals was developed, people were not generating point spacing anywhere near what we have now. It is the vertical accuracy that determines the contour interval allowed under the National Map Accuracy Standards and the National Standard for Spatial Data Accuracy (NSSDA).
So, let’s look at that, because our South Carolina friend, Randy, still has a problem. To make 1′ contours and follow the federal accuracy standards, you need 9.25 cm RMSE data. You can do that with lidar and most of our more recent collections are targeted at that. However, I don’t think any of the South Carolina collections had that as a specification. Some of them may meet it anyway, so you’d have to look at the QA reports to see what the data came in at. Randy may also be working in marsh areas and marshes often have accuracy problems.
For 6″ contours, you’d need under 5 cm RMSE. That’s pretty much going to happen when all the stars align or you’re flying from helicopter. We have seen some data that meets that criteria, but we’ve never used those specifications for a job because the cost would be very high; we’ve just gotten lucky that the stars aligned. Note that as technology improves, the stars align more often.
Do You Really Need That Accuracy?
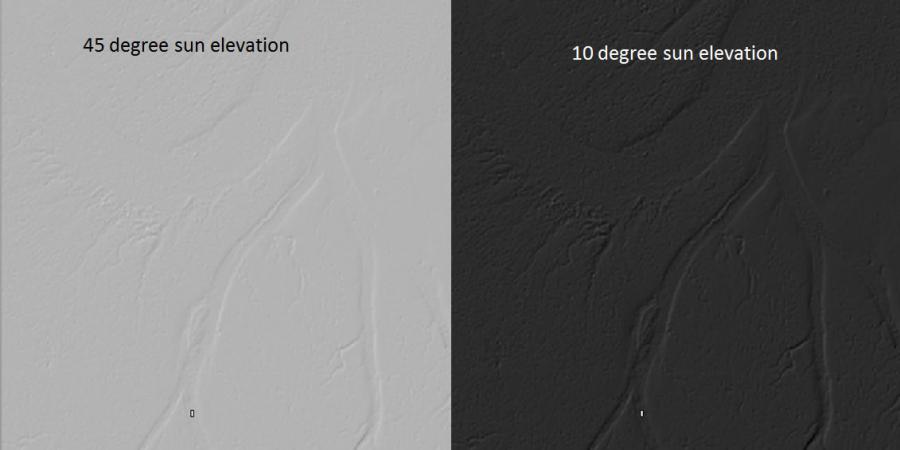
The last question I’d ask is whether Randy really needs contours to do his work. Randy, like many of us old dinosaurs, has grown up with paper maps with contours. Maybe we need some encouragement to look at things differently. Contours are generally something for visual interpretation by a human. You’re throwing out a lot of data and information when you make them and the rules for the intervals are related to that interpretation process in my opinion. What is he trying to see and/or do? There may be better ways to see features and you can often see features that are far smaller than the contours will pick up. For example, for some types of features, looking at hillshades made using a very low sun angle can make subtle features easier to see.
Of course, the reality is that accuracy and resolution aren’t totally unrelated. If I look at elevation data with a resolution of 30 meters, I have to wonder what an accuracy measure really means. Is that related to the average elevation within a cell? The minimum? The maximum? If there is significant variability within the cell (maybe a levee runs through it), is there even a right answer for the cell from which to judge its accuracy? As we look at smaller and smaller cells – higher resolution – we expect the height variability within the cell to decrease so we can at least make a more meaningful statement about the accuracy. But, accuracy and resolution are also not perfectly correlated either. Improvements in technology for lidar have made them both better, but the factors that make a lidar collection high resolution (high pulse rate or multiple overflights) are different than the factors that improve accuracy (closer base stations, narrow swath width, good PDOP).
So, how do you tell what you need? If you need to see spatial details, you need high resolution. If you need to really know how high something is, you need high accuracy. For a lot of today’s problems, you need both. Just make sure you know what you’re asking for or you never know what you’ll get.

Great post! I’ve thought about the semantics of this quite a bit while integrating Lidar sets, and it’s refreshing to see an informal discussion every once in a while. Thanks!
LikeLike
Hey all, I’ll point out that a past post highlights a similar issue related to land cover mapping (specifically this whole detail VS. accuracy concept). I agree that both concepts need to be considered, but stress that they are not interchangable terms (and point out that it IS actually possible to have a less detailed product that is more accurate… wrap your mind around that!).
LikeLike
Kirk,
I find you article a good read, and also contradictory. I think factors that define point accuracy are in effect the basic units that define feature accuracy – depicting the spatial details of targets. To repeat, the resolution of a feature has no spatial accuracy of its own, it depends on the accuracy and density of the points that depict it.
So, as point accuracy is the “atom” of feature accuracy, Randy is right. You are wrong to try to isolate feature accuracy from point accuracy. You are right that point accuracy is different from point spacing. But in the context of this discussion, Randy makes sense to me. Or maybe, I am just another Randy 🙂
I will want to point out that that a high spatial resolution does not necessarily translate into better feature depiction. Sometimes it only means increase in cost and processing time. Depending on the application envisioned, it is important to design you point density requirement to meet that need. I have read in http://eprints.usq.edu.au/3781/1/Liu_Zhang_Peterson_Chandra.pdf about LiDAR points reduced up to 50% but still allowing feature(DEMs in this case)accuracies to be below 20cm
LikeLike
Randy should also be aware of the difference between relative and absolute accuracy. Depending on what he needs one may be more important than the other. Following Toblers’s first law, higher density data (if systematic errors are minimized) should have higher relative accuracy than lower density data (points closer together should be more alike than points further apart). But this does not mean that the points have higher absolute accuracy (as compared to surveyed orthometric heights). So if you are delineating wetlands you may be more interested in relative accuracy, but if you are measuring the height of those wetlands relative to sea level absolute accuracy may be more important.
The use of referencing Lidar point densities and accuracies to contour accuracies has always bugged me (as you well know 🙂 ). I have always hated having to summarize digital data using an analog scale. We only need to use contour intervals when we are talking in terms of accuracies on paper, not with digital data. So unless he is drawing polygons on a paper map he should not care about contour intervals. And defining Lidar data accuracies by the points classified as ground is in essence completely ignoring a major part of the source data- the non bare earth and that is unfortunately the part that I have always been most interested in.
LikeLike
Patrick,
I think you’re bringing up a good point that I should have been clearer about. You’re right that you can’t completely separate accuracy from resolution since features would be unrecognizable regardless of resolution if the individual points weren’t sufficiently accurate relative to each other. I should have made it clear that I was talking about absolute accuracy, which is generally what would be considered for the contours Randy wanted. I really don’t have enough information from what Randy said to tell what he really needs. All I can really tell is that he thinks he needs a certain density of points in order to use a contour interval of a certain amount, and that isn’t the way it works. For many practical applications, you really would need both sufficient resolution and accuracy. For instance, if you need to judge if a levee is sufficiently high, you need to have the resolution to see the levee and the accuracy (at least relative to the water level) to make the judgment.
I completely agree with you that increasing point density does not necessarily result in better feature depiction. However, I don’t think there is a one size fits all answer for point density either. Every case is different and it depends on what you’re looking for. Also pulse density is not equal to point density, so if you’re trying to see features under trees, you’ll need a higher pulse density just to get enough points on the ground to see those features you wanted. That might make the non-tree areas seem over sampled.
Kirk
LikeLike
[…] and this has been discussed in many past blogs (“How Low Can You Go?” “Lidar – Accuracy Versus Resolution,” “Spatial Detail vs. Map Accuracy,” Resolution vs Minimum Mapping Unit). I’ll […]
LikeLike
Thanks for this post.
LikeLike
can someone comment or explain what the difference is between the various QL2 DEMs datasets available through North Carolina Emergency Management? Their all Quality Level 2 (QL2) and was collected at spacing of approximately 2 points per sq meter. But there are options for DEM05, DEM10, DEM20, DEM50… as i understand it that refers to 5ft, 10ft resolution? in which case DEM05 is the highest resolution or most accurate, correct?
To explore, just register an account and then look at ‘elevation’ data : https://sdd.nc.gov/sdd/DataDownload.aspx#
LikeLike
You are correct about the meanings for the DEMS. The DEM05 is certainly the highest resolution. Whether it is the most accurate probably depends on what you’re doing. Consider the case where accuracy refers to how well value of each cell represents the average height in the cell versus the case where accuracy refers to how well the value represents the height in the exact center of the cell. The DEM10 may actually have better accuracy than the DEM05 in the first case if it’s generated by averaging the points in the cell because it’s averaging more points, hence averaging out some of the random error (but you could make the DEM10 from the DEM05 with the same effect). If the DEMS were generated by a TIN, there probably is no difference in the accuracy since the value will be determined by the 3 points around the cell center that make that particular triangle. If you care about the value at the exact center and the cells were made by averaging, the 5ft DEM is going to be more accurate. By the way, if you were going to do something like a beach volume calculation, you probably want the cell value to represent the average for the cell.
There are still two fundamentally different things going on though. How close are the points to each other (the ground sample distance, often called resolution) and what error distribution can we expect each point to have from the true value (accuracy). When you make a DEM, you’re making a derived product and how you do it will affect both the resolution and the accuracy.
You might be wondering why they have all those options. The higher the resolution, the more data you have to deal with. That can get unwieldy if you’re doing county or statewide calculation. Especially if you’re modeling, you probably want input data that is roughly the resolution of your other model inputs. North Carolina is simply making multiple options available to meet user needs.
~Kirk
LikeLike
Thank you, Kirk for that thorough explanation!
LikeLike
Reblogged this on Everything is Spatial.
LikeLike